Categories
Docker linux Security Windows Server

Setting up RDPGW in docker

I was looking into setting up an instance of RDPWG for a client.

The client currently has a bunch of Windows server VMs in Workgroup which they currently connect to on port 3389 directly exposed to the internet which is obviously a massive security issue.
Additionally, the RDP port is often blocked on corporate networks.

The better option would be to set up an Active Directory domain and an RDP Gateway server, but as a quick alternative while the client decides if the cost is worth it I set up an RDP Gateway using the Open source project RDPGW.

The project itself is very interesting but the documentation is unfortunately seriously lacking and it took me quite a bit of effort to get everything set up, so I wanted to share the results in case it helps someone.

I didn’t find a way to get RDPGW to work behind a reverse proxy, so in this setup you need 2 public IP address if you intend to host Keycloak on port 443 unfortunately.

Setup

This is the docker-compose.yml file:

version: "3.9"
services:
  postgres:
    container_name: db
    image: "postgres:14.4"
    restart: always
    healthcheck:
      test: [ "CMD", "pg_isready", "-q", "-d", "postgres", "-U", "postgres" ]
      timeout: 45s
      interval: 10s
      retries: 10
    volumes:
      - ./postgres_data:/var/lib/postgresql/data
      #- ./sql:/docker-entrypoint-initdb.d/:ro # turn it on, if you need run init DB
    environment:
      POSTGRES_USER: postgres
      POSTGRES_PASSWORD: postgres
      POSTGRES_DB: keycloak
      POSTGRES_HOST: postgres
    networks:
      - pgsql

  keycloak:
    container_name: keycloak
    image: quay.io/keycloak/keycloak
    command: ['start', '--proxy', "edge"]
    restart: always
    depends_on:
      postgres:
        condition: service_healthy
    environment:
      JAVA_OPTS_APPEND: -Dkeycloak.profile.feature.upload_scripts=enabled
      KC_DB_PASSWORD: postgres
      KC_DB_URL: "jdbc:postgresql://postgres/keycloak"
      KC_DB_USERNAME: postgres
      KC_DB: postgres
      KC_HEALTH_ENABLED: 'true'
      KC_HTTP_ENABLED: 'true'
      KC_METRICS_ENABLED: 'true'
      KC_HOSTNAME_STRICT_HTTPS: true
      KC_HOSTNAME: rdgateway-keycloak.example.com
      PROXY_ADDRESS_FORWARDING: 'true'
      KEYCLOAK_ADMIN: admin
      KEYCLOAK_ADMIN_PASSWORD: password
    healthcheck:
      test: ["CMD-SHELL", "exec 3<>/dev/tcp/127.0.0.1/8080;echo -e \"GET /health/ready HTTP/1.1\r\nhost: http://localhost\r\nConnection: close\r\n\r\n\" >&3;grep \"HTTP/1.1 200 OK\" <&3"]
      interval: 10s
      retries: 10
      start_period: 20s
      timeout: 10s
    ports:
      - "8080:8080"
      - "8787:8787" # debug port
    networks:
      - pgsql
      - keycloak

  rdpgw:
    image: bolkedebruin/rdpgw:latest
    restart: always
    container_name: rdpgw
    ports:
      - "80:80"
      - "443:443"
    volumes:
      - ./rdpgw.yaml:/opt/rdpgw/rdpgw.yaml
    depends_on:
      keycloak:
        condition: service_healthy
    networks:
      - keycloak

networks:
  pgsql:
    driver: bridge
  keycloak:
    driver: bridge

you need to create a postgres_data directory (or use a volume).

This is the rdpgw.yaml file (look a the documentation for information on secrets):

Server:
 Tls: auto
 GatewayAddress: rdgateway.example.com
 Port: 443
 Hosts:
  - rdshost-1.com:3389
  - rdshost-2.com:3389
 RoundRobin: any
 SessionKey: changeme
 SessionEncryptionKey: changeme
Authentication:
 - openid
OpenId:
 ProviderUrl: https://rdgateway-keycloak.example.com/realms/rdpgw
 ClientId: rdpgw
 ClientSecret: 01cd304c-6f43-4480-9479-618eb6fd578f
Client:
 UsernameTemplate: "{{ username }}"
 NetworkAutoDetect: 1
 BandwidthAutoDetect: 1
 ConnectionType: 6
 SplitUserDomain: true
Security:
  PAATokenSigningKey: changeme
  UserTokenEncryptionKey: changeme
  VerifyClientIp: false
Caps:
 TokenAuth: true
 IdleTimeout: 10
 EnablePrinter: true
 EnablePort: true
 EnablePnp: true
 EnableDrive: true
 EnableClipboard: true

The “hosts” section describes all the hosts the server allows access to.

Configuration

After all the files have been created in your chosen directory, you can run

docker compose up -d

After some time it will bring up Postgres and then Keycloak. RDPGW will not come up before we’ve create the new realm in Keycloak.

You will need to handle the reverse proxying of Keycloak on your own, it is outside the scope of this article.

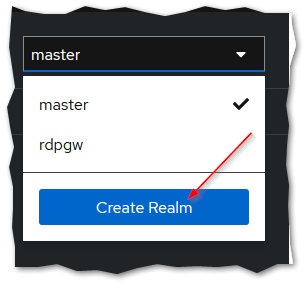
Login to Keycloak with the user you’ve defined in the configuration file and on the top left, create a new Realm:

There, you can import the Realm configuration from here.

It will create a realm named “rdpgw” with a single user named “admin@rdpgw” with password “admin” (which you should change promptly)

Once this is done, the RDPGW container should come up.

You should be able to use https://rdgateway.example.com/connect and login with the user “admin@rdpgw”.
It will download a .rdp file, which you should be able to open to connect to the first host in the list.

If you want to connect to a specific host, you should use https://rdgateway.example.com/connect?host=destination-host-url1.com
Categories
Backup Docker Zabbix

Monitoring Synology Active Backup for business and Snapshot Replication with Zabbix

Active Backup for Business

We use Synology Active Backup for business as a backup solution for our Hyper-v hypervisors.

It works really well, but Synology hasn’t exposed any way to monitor it from SNMP or anything else.

I have seen many people asking how to monitor it, and the best solution I have seen requires connecting to the NAS unit using SSH, as root and running a script to read the ABB sqlite database.

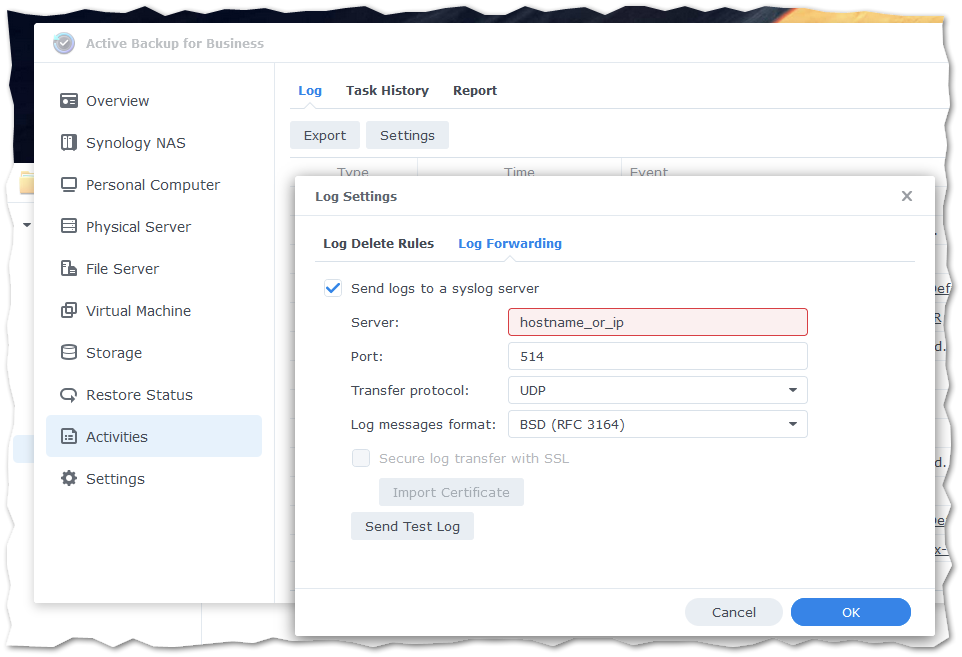
I noticed that in ABB there is a configuration option to ship logs to a syslog server, which is easily monitored using Zabbix.

The log forwarding configuration in Active Backup for Business

Using a syslog-ng server in docker container, I set up everything to receive the logs:

---
version: "3.7"
services:
  syslog-ng:
    image: linuxserver/syslog-ng
    environment:
      - PUID=1000
      - PGID=4
      - TZ=Europe/Brussels
    volumes:
      - /srv/syslog-ng/config:/config
      - /srv/syslog-ng/log:/var/log
    ports:
      - 514:5514/udp
      - 601:6601/tcp
      - 6514:6514/tcp

The syslog-ng configuration file is very simple and to the point:

#############################################################################
# Default syslog-ng.conf file which collects all local logs into a
# single file called /var/log/messages tailored to container usage.

@version: 3.35
@include "scl.conf"

source s_local {
  internal();
};

source s_network_tcp {
  syslog(transport(tcp) port(6601));
};

source s_network_udp {
  syslog(transport(udp) port(5514));
};

destination d_local {
  file("/var/log/messages" perm(0640));
  file("/var/log/messages-kv.log" template("$ISODATE $HOST $(format-welf --scope all-nv-pairs)\n") frac-digits(3) perm(0640));
};

log {
  source(s_local);
  source(s_network_tcp);
  source(s_network_udp);
  destination(d_local);
};#

The log arrive in real time:

syslog-ng logs

Snapshot Replication

In the Snapshot replication app, there is not option to configure log shipping.

However, in the background, the apps uses the same mechanism as ABB for log management: an instance of syslog-ng on the Synology NAS.
The logs end up in: /var/log/synolog/synodr.log (it seems that snapshot replication is called Disaster Recovery internally at Synolog)

We just need to push a configuration file to in the syslog-ng patterndb.d folder (/etc/syslog-ng/patterndb.d/snapreplication.conf) with the appropriate permissions (owner “system”, group “log”, mode 644) which contains this: (replace {{ HOSTNAME }} with the hostname of your syslog-ng destination server)

@version: 3.34

source snapshot_replication {
    file("/var/log/synolog/synodr.log");
};
destination docker {
        network(
                "{{ HOSTNAME }}"
                port(514)
                transport(udp)
                ip-protocol(4)

                log_fifo_size(50000)
                keep_alive(no)
        );
};

log {
    source(snapshot_replication); destination(docker);
};

You juste need to restart the syslog-ng server on the NAS and you’re good to go:

systemctl restart syslog-ng

Logs will then start to appear in the syslog-ng docker container:

Zabbix

You can use the templates here to monitor the logfile using Zabbix.

It uses Zabbix Active check so you need to make sure that is set up correctly.

Categories
Docker

Rexray S3fs docker plugin and Scaleway

I have been looking far and wide for a solution for docker swarm persistent volume shared among multiple hosts and nothing seemed to be easily deployable, reasonnably fast and reliable.

Glusterfs is slow as hell on every hardware I’ve tried to run it, Ceph seems very complicated to set up for a simple swarm setup.

Now I’ve begun experimenting with Rexray S3FS docker plugin and it seems quite interesting.

The only issue I’ve had is that I’m using Scaleway for hosting and I could not find a way to make it work with their S3 implementation.

I was missing a crucial piece of the puzzle: you need to specify the S3FS_REGION option, which is not mentionned in the scaleway docs, so the command line looks like this:

docker plugin install --grant-all-permissions rexray/s3fs:latest \
S3FS_ACCESSKEY=XXXXXXXXXX\
S3FS_SECRETKEY=YYYYYYYYYYYYY \
S3FS_ENDPOINT=https://s3.fr-par.scw.cloud \
S3FS_REGION=fr-par \
S3FS_OPTIONS="allow_other,nonempty,use_path_request_style,url=https://s3.fr-par.scw.cloud"

Also, it seems that the plugin tries to delete existing buckets, so I’ve created a separate account for docker S3 volumes, just to be safe.

Categories
Docker home assistant home automation

Home assistant and docker swarm

I’ve been trying to get Homeassistant working on swarm for a few months now, but the thing that was preventing me from moving to swarm was the Homeassistant requirement to use host networking on the container.
I had tried many things but I finally got everything to work with the macvlan driver. I configured the homeassistant service with two networks:

  • One macvlan network, giving it an IP address in my iot network
  • One overlay network, giving traefik access to homeassistant

The macvlan network is configured as follows. I had to create a local macvlan network on each member of the swarm, with a subnet swarm is free to choose an IP from:

1st node:
docker network create –config-only –subnet=192.168.2.0/24 –gateway=192.168.2.1 -o parent=eth0 –ip-range 192.168.2.232/29 macvlan_local
2nd node:
docker network create –config-only –subnet=192.168.2.0/24 –gateway=192.168.2.1 -o parent=eth0 –ip-range 192.168.2.240/29 macvlan_local
3rd node:
docker network create –config-only –subnet=192.168.2.0/24 –gateway=192.168.2.1 -o parent=eth0 –ip-range 192.168.2.248/29 macvlan_local

Then I create a swarm scoped network:

docker network create -d macvlan –scope swarm –config-from macvlan_local macvlan_swarm

Then I can deploy the whole stack, here is the docker-compose file:
(the wait-for-it config is a script that prevents homeassistant from starting before mqtt, it’s not necessary but quite useful)

version: '3.7'

configs:
  wait-for-it:
    file: /srv/docker/homeassistant/wait-for-it/wait-for-it.sh

services:
  homeassistant:
    image: homeassistant/armhf-homeassistant:0.86.4
    configs:
      - source: wait-for-it
        target: /wait-for-it.sh
        mode: 755
    networks:
      - webgateway
      - macvlan_swarm
    command: ["/wait-for-it.sh", "rasper:1883", "--", "python", "-m", "homeassistant", "--config", "/config"]
    volumes:
      - /srv/docker/homeassistant/config:/config
      - /etc/localtime:/etc/localtime:ro
    deploy:
      labels:
        - "traefik.backend=hassio"
        - "traefik.frontend.rule=Host:myhomeassistanthostname"
        - "traefik.port=8123"
        - "traefik.enable=true"
        - "traefik.docker.network=webgateway"
        - "traefik.default.protocol=http"

  mosquitto:
    image: eclipse-mosquitto
    volumes:
      - /srv/docker/mosquitto/config:/mosquitto/config
      - /etc/localtime:/etc/localtime:ro
      - /srv/docker/mosquitto/data/mosquitto-data:/mosquitto/data
      - /srv/docker/mosquitto/data/mosquitto-log:/mosquitto/log
    ports:
      - "1883:1883"
      - "9001:9001"

  nodered:
    image: nodered/node-red-docker:rpi-v8
    deploy:
      labels:
        - "traefik.backend=nodered"
        - "traefik.frontend.rule=Host:mynoderedhostname"
        - "traefik.port=1880"
        - "traefik.enable=true"
        - "traefik.docker.network=webgateway"
        - "traefik.default.protocol=http"
    networks:
      - webgateway
    volumes:
      - /srv/docker/nodered:/data
    environment:
      - TZ:Europe/Brussels


volumes:
  mosquitto-data:
  mosquitto-log:

networks:
  webgateway:
    external: true
  macvlan_swarm:
    external: true
  hostnet:
    external: true
    name: host
Categories
Docker

HSTS with Traefik 1 and Docker

I’ve recently started to move the stuff I host to Docker, using the Traefik reverse proxy as the SSL termination.

Traefik is a really nice piece of software, but unfortunately while the documentation is great, it’s somewhat missing in tutorials and examples.

Among other things, I host a Nextcloud instance, and among the security suggestions, it tells me to add a Strict-Transport-Security header with a value of at least 15552000.

In my case, it was not strictly necessary as edzilla.info is already using HSTS preloading, but I wanted to follow the security suggestions to the letter.

To add the header to any host reverse proxied service, you simply have to add a label such as this:

traefik.frontend.headers.customResponseHeaders=Strict-Transport-Security:15552000